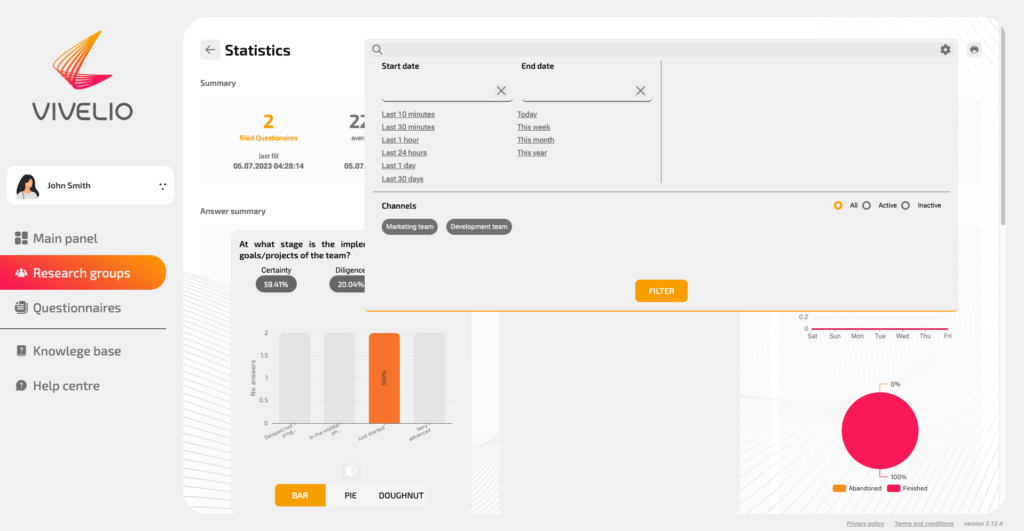
In the statistics section, after clicking the ,,Show more” button, you will see a summary of statistics from the entire survey, where for each question you can see the responses in the form of a bar chart, pie chart or ring chart. Filtering statistics allows you to view selected data from selected response channels, with a specific status or start and end time of the survey.
Selection can be done at levels selected by the researcher, which include:
- The start date or end date for completing the questionnaire. You can enter it by selecting any date in the calendar, which will launch when you press the button to enter the date, or by selecting one of the proposed ranges (e.g., the last 24 hours)
- Lists of all channels
- Status of the channels (active and inactive)